Create Dynamic Dashboards with Products | Bamboo Solutions
Bamboo Solutions offers a myriad of products that can aid your company in organizing and displaying information. Some of our products specialize in grabbing data from several different locations and rolling them up into one convenient location, calendar plus for example, or list rollup. Other products by Bamboo Solutions specialize in displaying information with more quickly recognizable graphics and visuals. These products are geared towards helping a company create dashboards with which to display their metrics. Two of Bamboo Solutions’ products that offer column-level dashboard display options are KPI and Visual Indicator.
KPI by Bamboo Solutions
KPI by Bamboo Solutions allows a company to use existing SharePoint Lists and column data to create dashboard metrics with accompanying visuals.

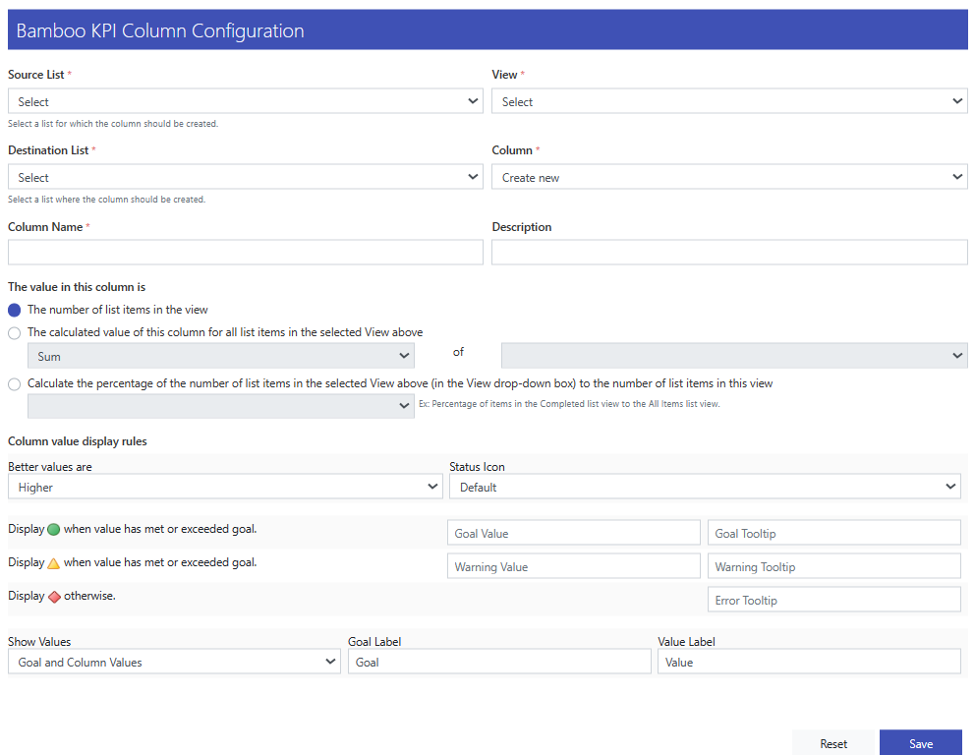
After selecting a source list and list view, KPI by Bamboo Solutions will output the results of the new KPI column that is to be created into a list as defined by the user. KPI is able to display goal/value metrics based on three situations:
- Number of items in the list view
- Sum/min/max/average of an identified column
- Percentage of items in selected list view vs total number of items in the list
After defining where to get the values for the KPI column, the user can then define what the metrics should look like. Are higher or lower values preferred? What’s a good value vs. a warning value vs. a bad value? After defining the above you can then determine what to show in the KPI destination list.

After putting the finishing touches on how the KPI column should be displayed, press save, and the KPI column will be generated in the above-determined destination SharePoint list. Below is an example of three different KPI columns showing three other metrics. The “Overbudget” hover was defined using the KPI webpart by Bamboo Solutions, each of the KPI columns has the ability to provide a tooltip upon hover depending upon the values set by the user.

The column can be shown or hidden just as any other SharePoint out-of-the-box column can be manipulated. At any time, the existing KPI columns can be modified or deleted using the KPI webpart. Also, in addition to being able to access the KPI webpart by placing the webpart on its own page, Bamboo Solutions has a button available at the top of every list to quickly generate a KPI column from the list you are currently on:

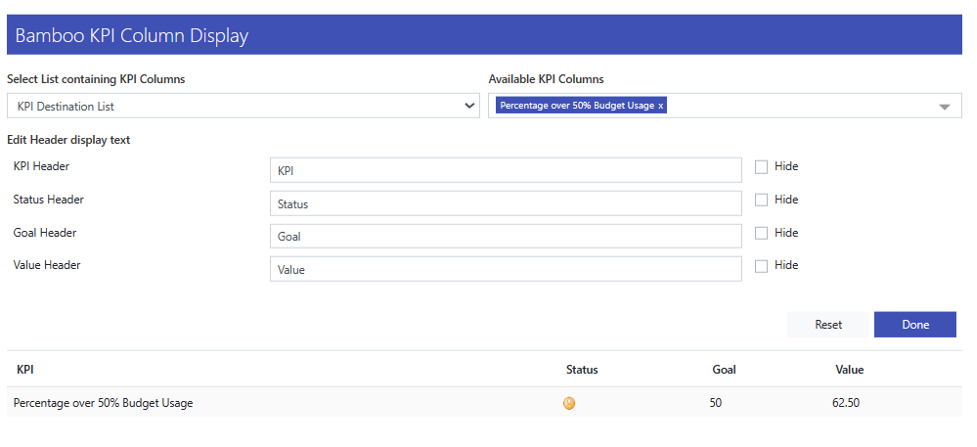
KPI also has a second webpart entitled Bamboo KPI Column Display that allows a quick lookup of any existing KPI columns in the site collection and their results.

In addition to being able to jump to any KPI column information quickly, it also allows for a quick modification of the way metrics are shared and displayed for each column that is selected.
Visual Indicator by Bamboo Solutions

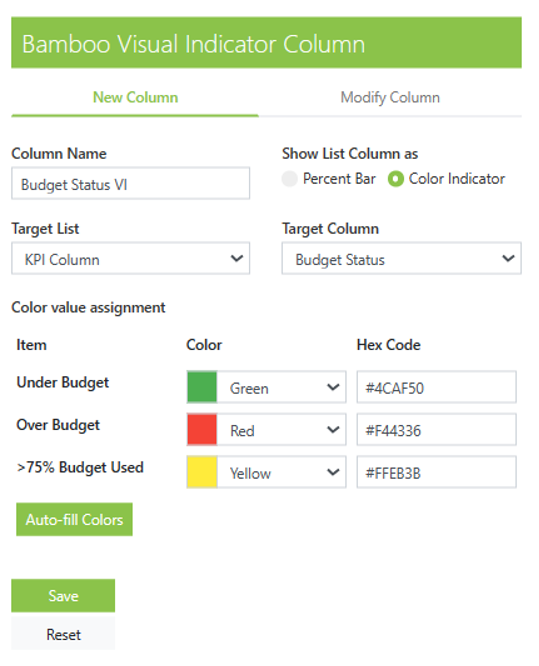
Another Bamboo Solutions product that can display dashboard information at the column level on SharePoint lists is Visual Indicator or VI for short. The two ways that Visual Indicator can display metrics is through a percentage bar or a color indicator. The Visual Indicator webpart sources information from an existing SharePoint list and creates a column in that list with a visual representation of the data with customization as the user defines them.
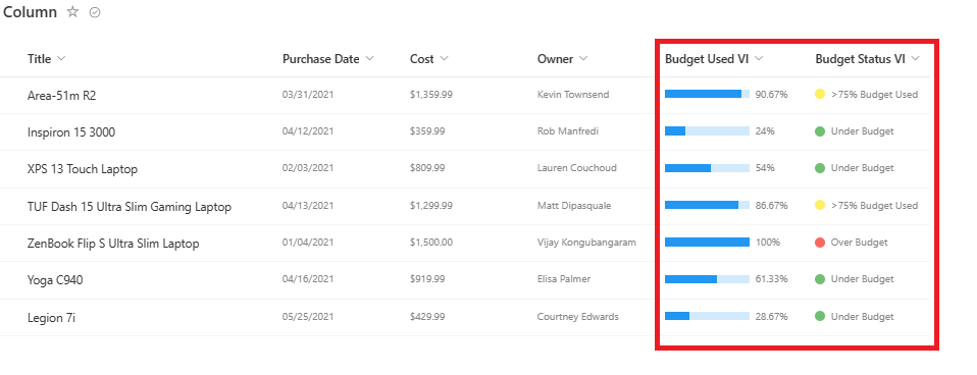
As with the KPI column by Bamboo Solutions, the Visual Indicator columns can be shown or hidden in a list view just as any SharePoint out-of-the-box columns can be manipulated. Below, you can see a representation of both the percentage bar visual indicator column and a color indicator visual indicator column.

KPI and Visual Indicator by Bamboo Solutions both allow a company to display their data in a dashboard-friendly format quickly and efficiently. Leveraging these products will enable your company to utilize the data that already exists in your SharePoint to track information more effectively. They can also help a company make better use of SharePoint as an environment overall and possibly consolidate business processes within their company.
Bamboo Solutions products can help you create dynamic dashboards in your SharePoint environment. Start a trial today or contact us for more information!

