

How To Get Started Using Chart Plus?
Chart Plus is a web part by Bamboo Solutions for SharePoint environments. This allows a SharePoint administrator to easily add visually dynamic charts and graphs to their SharePoint site. The web part has versions available for SharePoint Online, and SharePoint on-premises in 2013, 2016, and 2019. Just like all other Bamboo Solutions products, Chart Plus can be easily integrated into your existing SharePoint environment.
After Chart Plus has been to your tenant’s/app catalog and deployed for use, the web part can be added to a page in the same manner that any SharePoint out-of-the-box applications are added to a page. Below is an image of what the Chart Plus icon will look like when adding the web part to a page in your SharePoint environment.
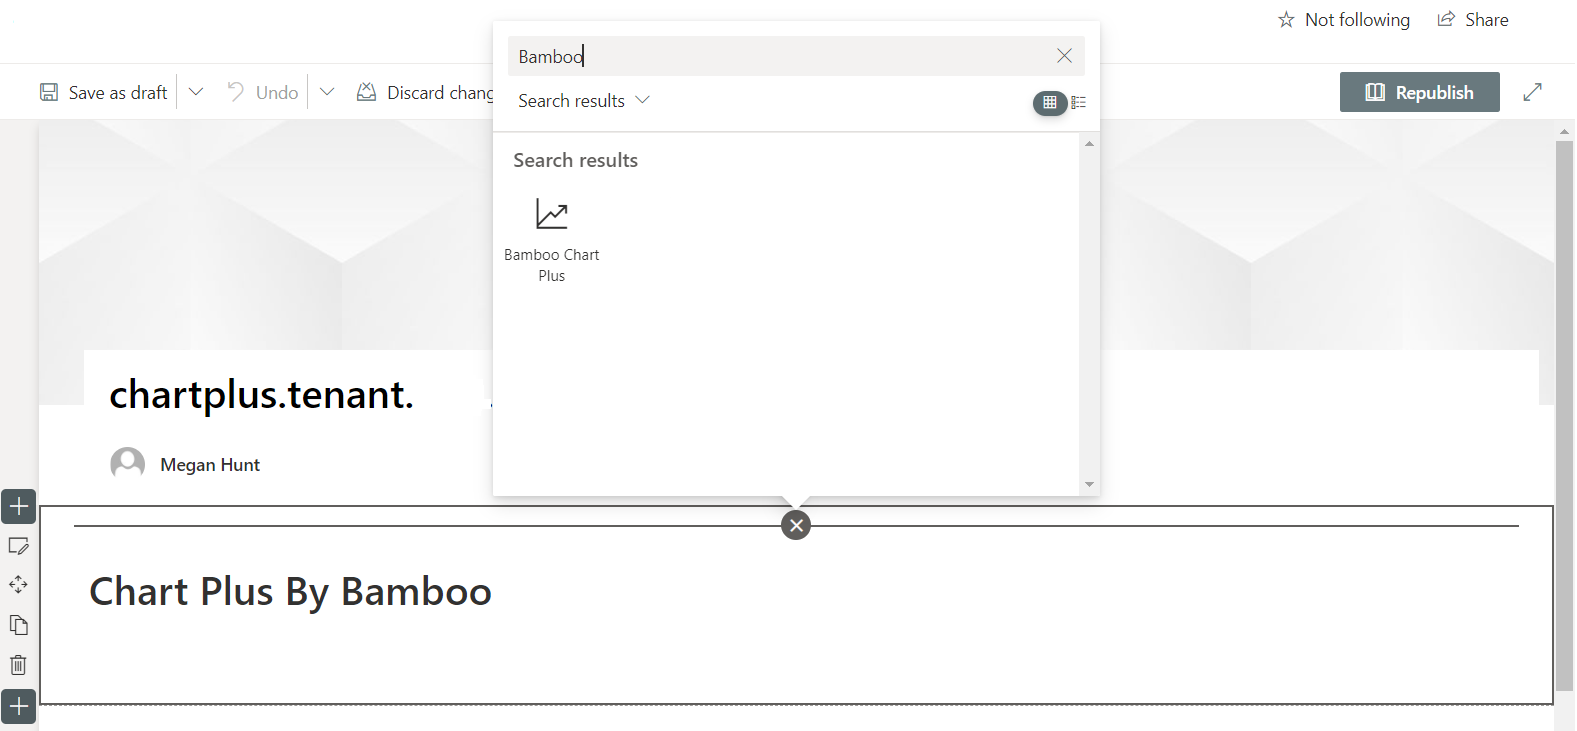
Adding Chart Plus to your webpage
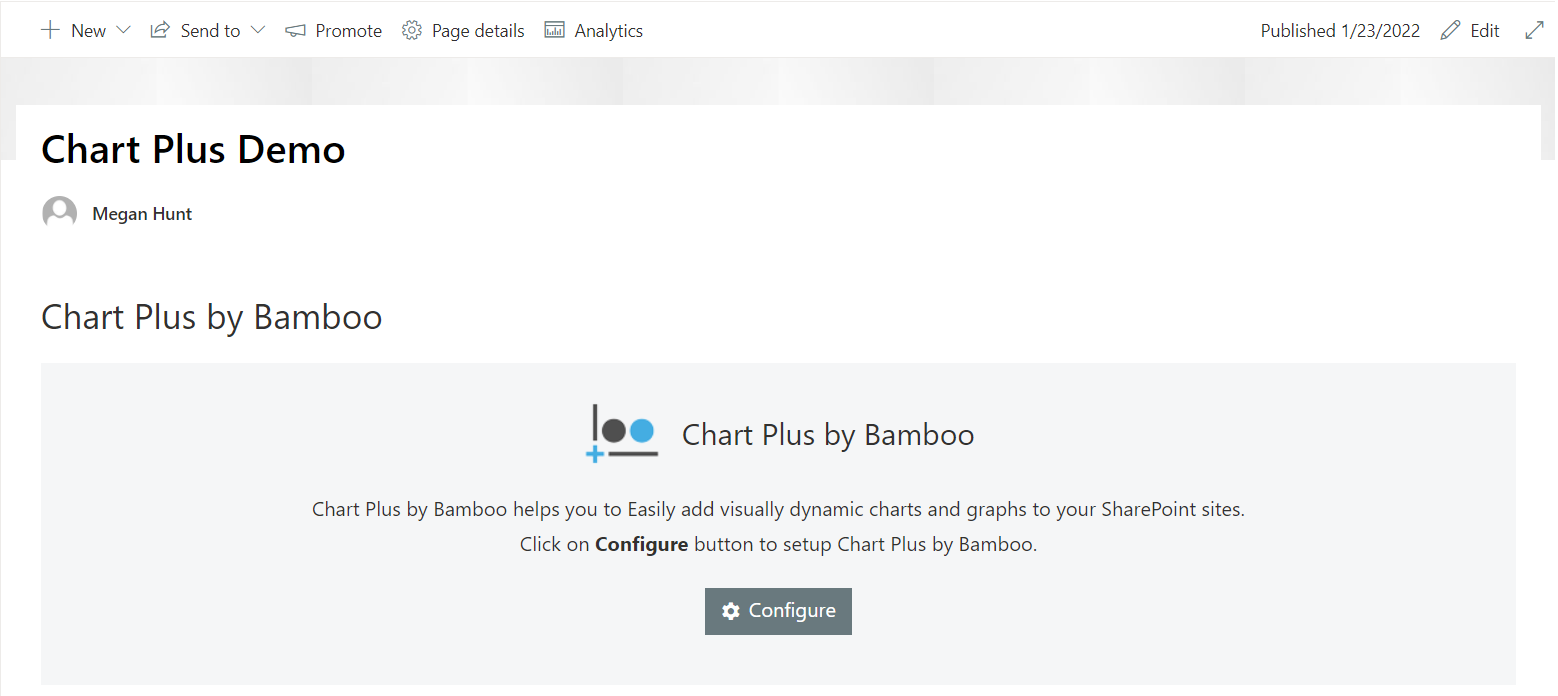
Additionally, by adding the Chart Plus web part to your page, you will want to configure the web part with what data you would like it to reflect. Also, how you would like that data to be displayed? After publishing the page that you are editing, simply click the “Configure” button that appears on the Chart Plus web part that you have just added to your page. See below for what an unconfigured Chart Plus web part will look like.
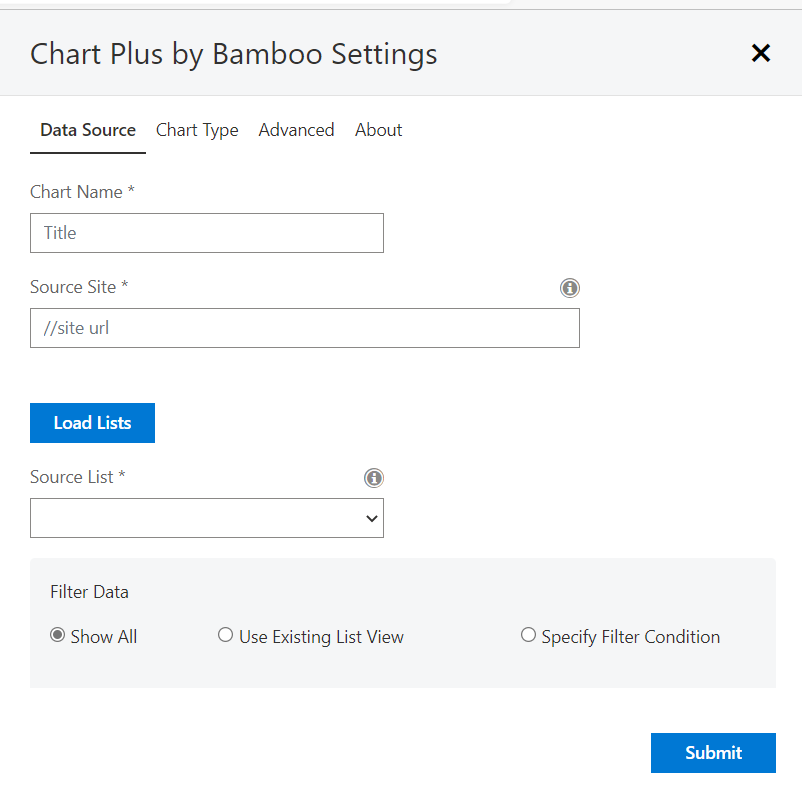
By selecting the configure button a settings panel will pop up on the right-hand side of your screen. Accordingly with all Bamboo Solutions web parts, and also in the continuation of how SharePoint out-of-the-box modules operate. Further, in this article, we will discuss the finite details of the options available in the settings panel. Below is a view of what an administrator will see when first configuring the Chart Plus web part.
Once the source site is entered, the lists from that site are loaded into the drop-down. Select the list that contains the information you would like the Chart Plus web part to display. At any time, an admin can update or change the information displayed. Clicking the Chart Plus web part gear at the top right-hand corner of the web part, as displayed in the picture below.

How can Chart Plus quickly turn data into consumable information?
Part of what makes the products developed by Bamboo Solutions so convenient and valuable is that most, if not all, of their products, are designed to optimize the presentation of data that already exists in a SharePoint environment. That is not to say that the products don’t also help to create new data and more useful ways to store data in SharePoint. The use of a Bamboo Solutions product will open up many doors on how you can leverage information storage and consumption within a SharePoint environment.
In the instance of Chart Plus, this web part can quickly be added to your SharePoint tenant, as described in the first section of this article. After the web part is added to your tenant you can populate Chart Plus with any existing list or you can also create a new list as well. See below for an example of selecting a list to load into your Chart Plus web part.
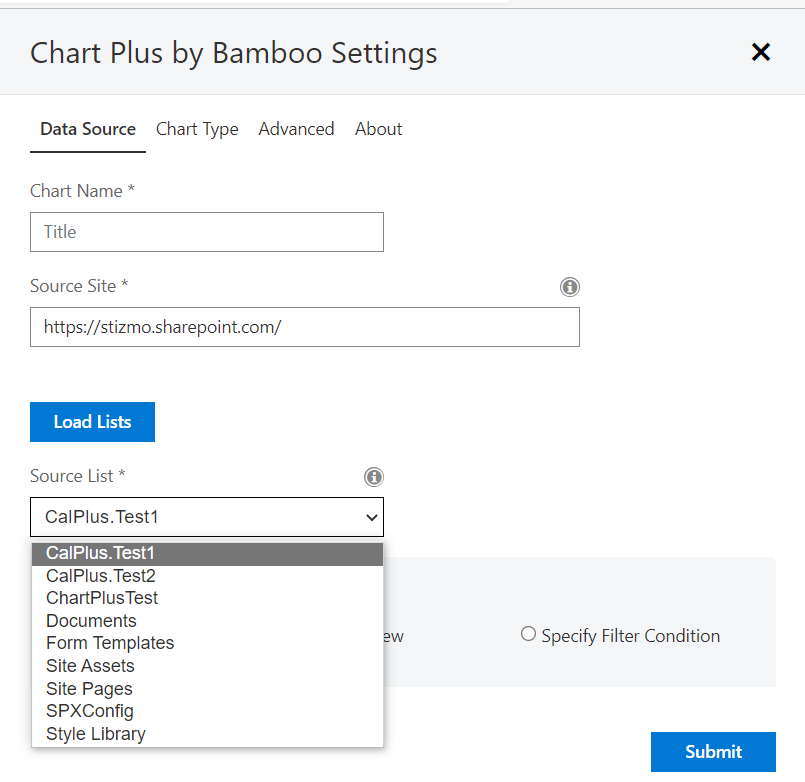
Selecting the list for your Chart Plus display
Select the list that you would like your Chart Plus web part to display, you can run through the settings tabs (Chart type, Advanced, and About) and customize the way the information will be displayed. The details of the customization options that are available will be broken down later in this article. Chart Plus allows for a range of display options from simple and basic to more complex. Because of the intuitiveness of the Chart Plus web part, however, all display options feel very simple to set up!
The Chart Plus web part offers nine different chart types to display information. Within those nine different charts, there are four different options to display the Y-axis data. In addition to that, you can change which columns are displayed from your list. The result is that one list can generate many different informational charts.
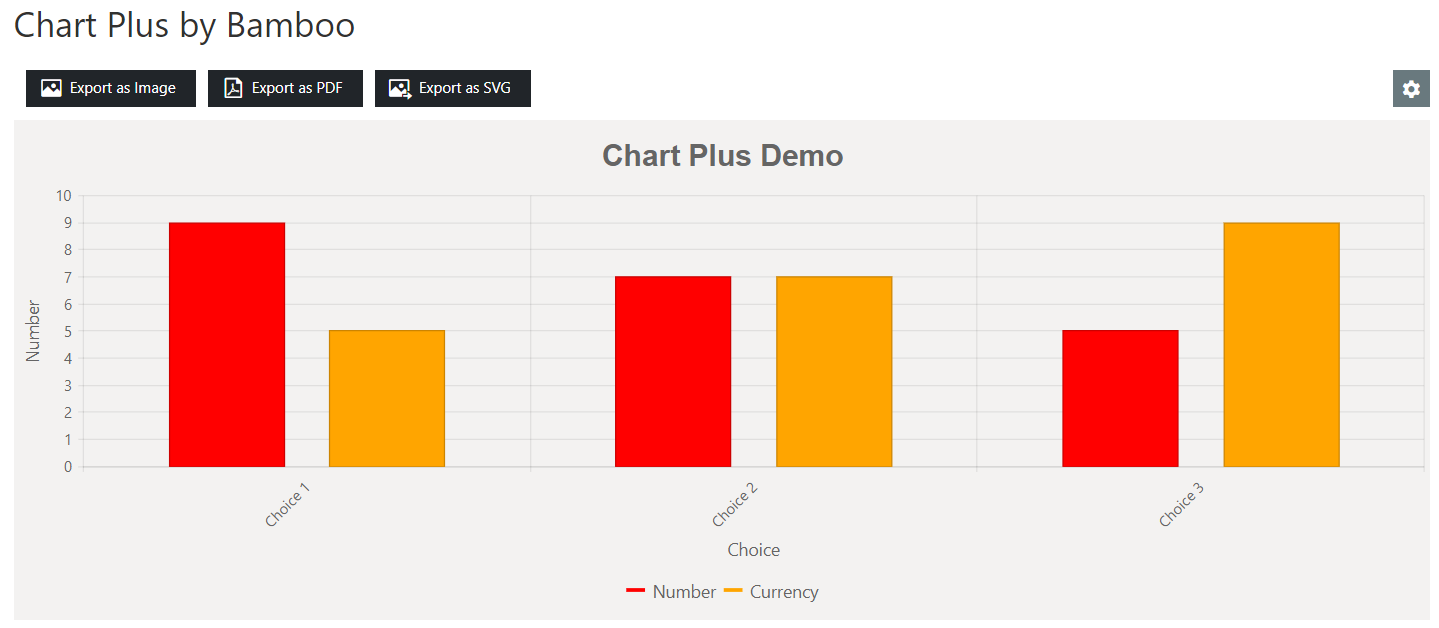
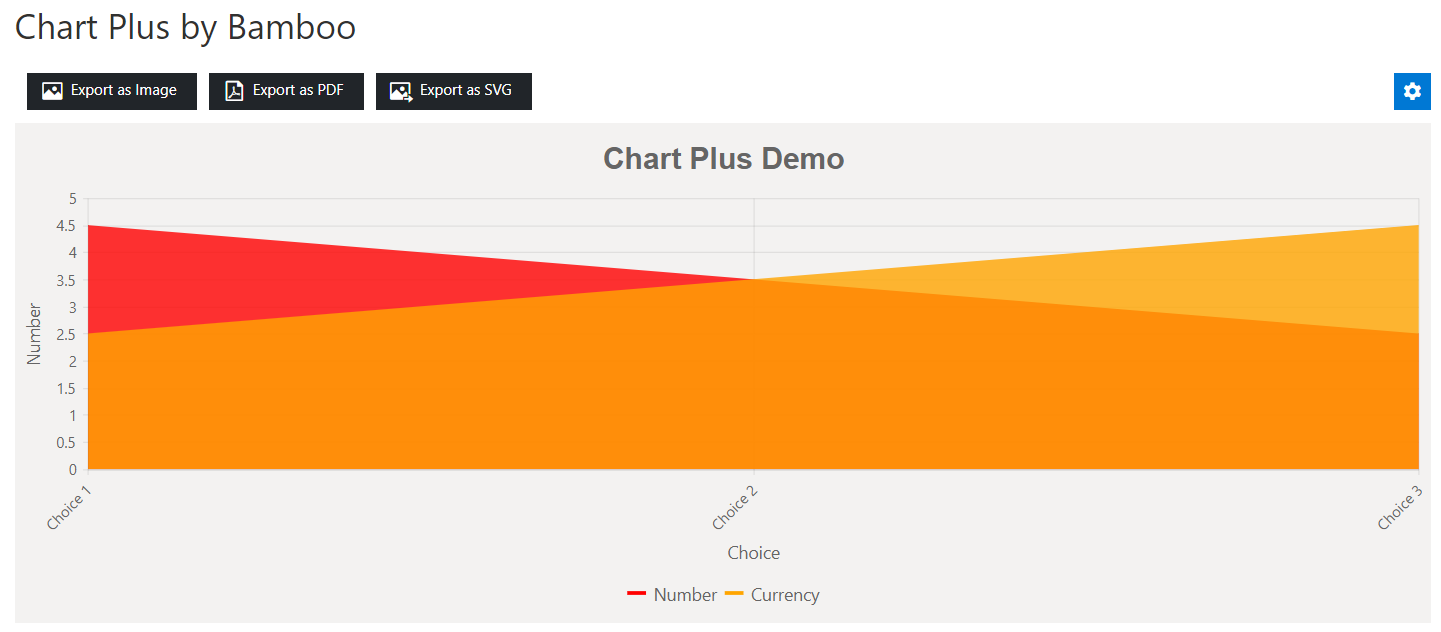
Examples of two charts depicting the same information but designed in two separate styles are below.
Column:
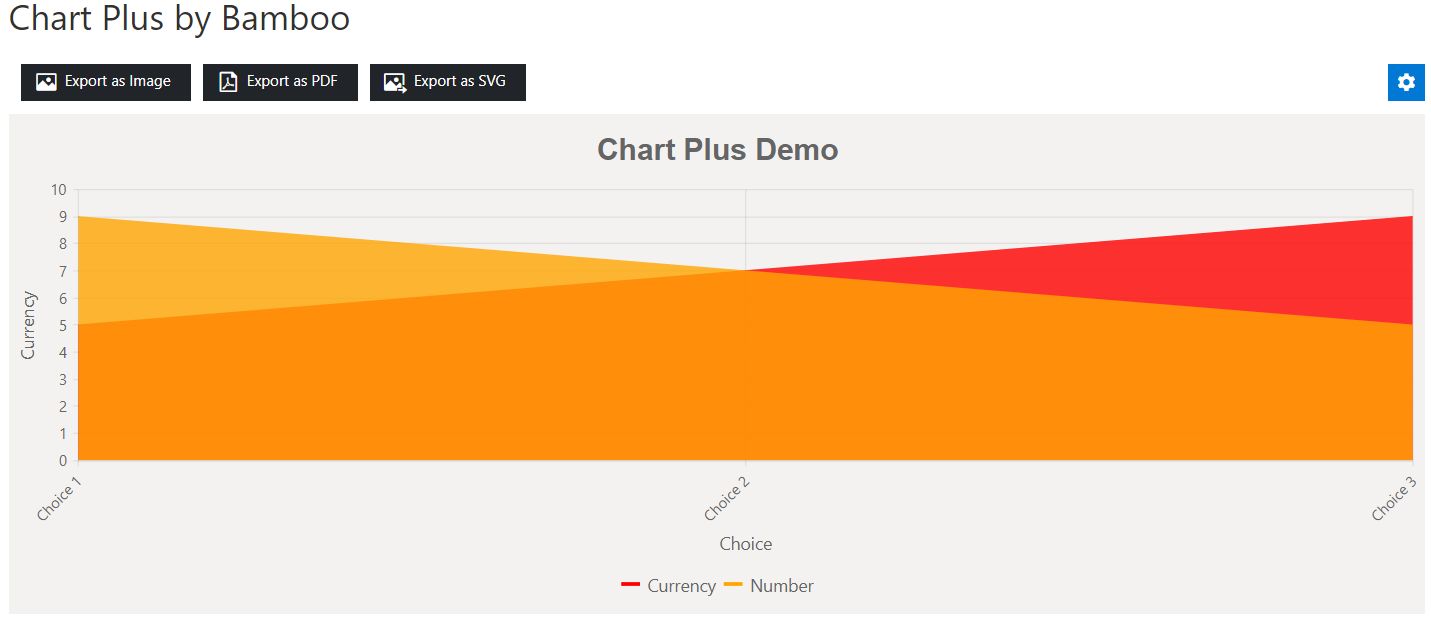
Area:
How can Chart Plus display the data in different ways?
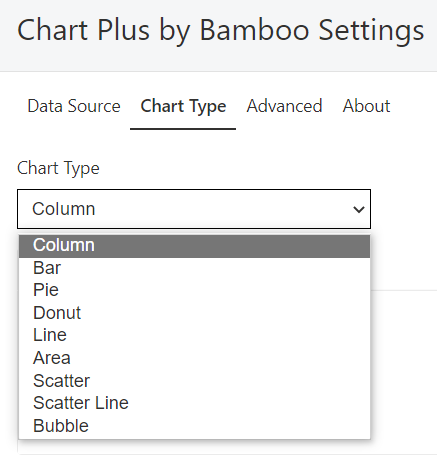
Load your list into the Chart Plus web part using the “Data Source” tab in the ‘Chart Plus by Bamboo Solutions’ settings panel. At this point, you can define how the information will be displayed using the “Chart Type” tab. Here you select the type of chart that will be used to display the information, and subsequently the X and Y axes.

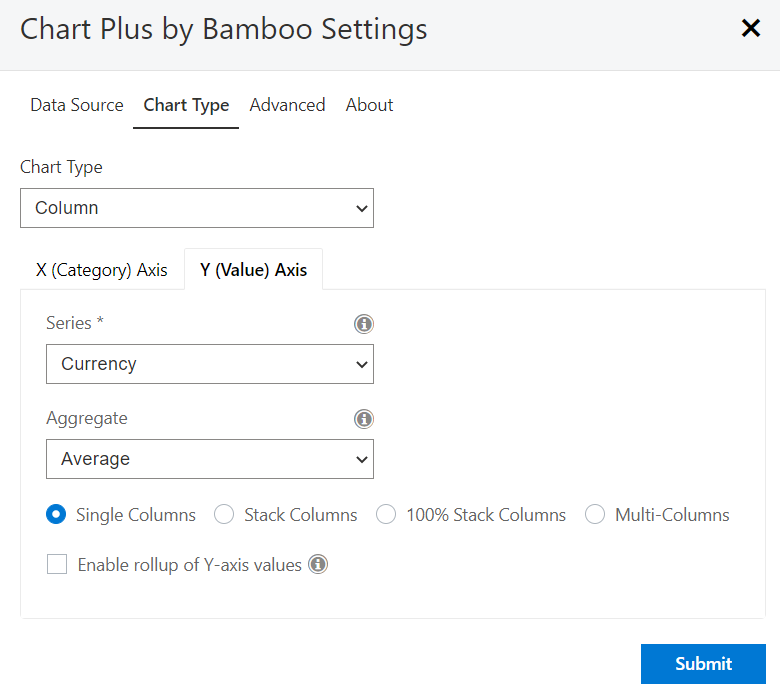
As you can see in the picture above, the X (Category) Axis is the first to be defined when setting up the Chart Plus web part. You can also choose whether or not to enable aggregation in this area. After defining the X-Axis, tab over to the Y (Value) Axis where you can proceed to define the series. The means of aggregation, and the way the Y series information should be displayed (see image below).
Aggregation Options
The series field allows you to pick from columns within your list. The aggregate field allows you to choose between “Sum” and “Average” aggregation. Every chart type then has four options to choose from in terms of displaying the Y series information:
- Single Columns
- Stack Columns
- 100% Stack Columns
- Multi-Columns.
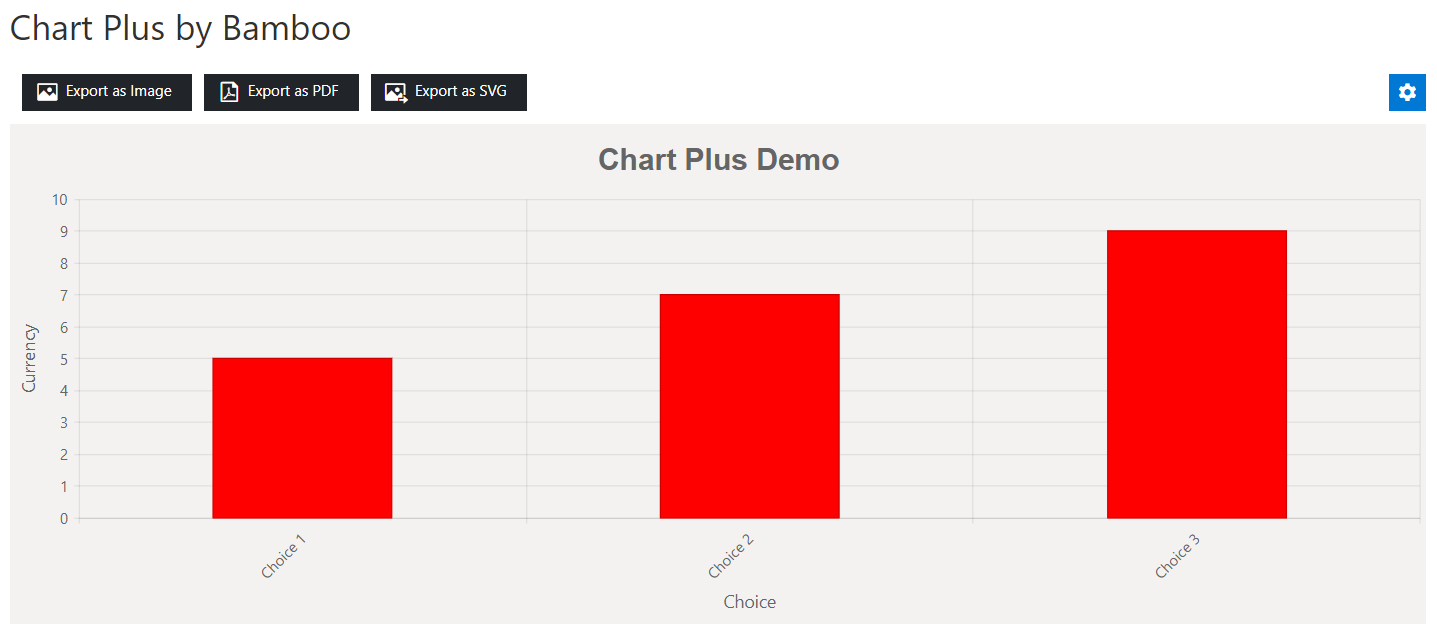
These images of each option respectively, use that same data so you can observe the differences.
Single Columns:
Stack Columns:

100% Stack Columns:
Multi-Columns:

All of the above chart pictures show different ways that the data can be displayed using the “Column” chart type. The following pictures will iterate through all the different chart types available using the Chart Plus web part. As mentioned above, there are nine different chart types available; Column, Bar, Pie, Donut, Line, Area, Scatter, Scatter Line, and Bubble. As a reminder, every one of these chart types also has the four above different options for displaying the information.
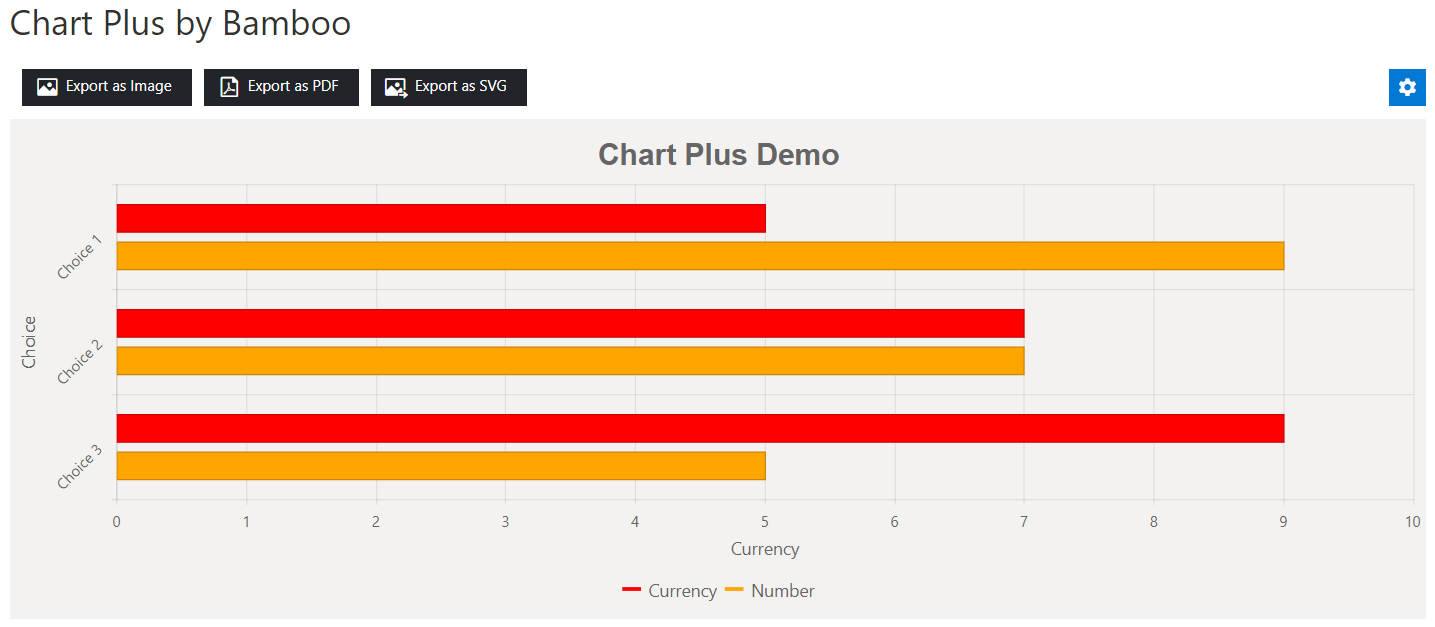
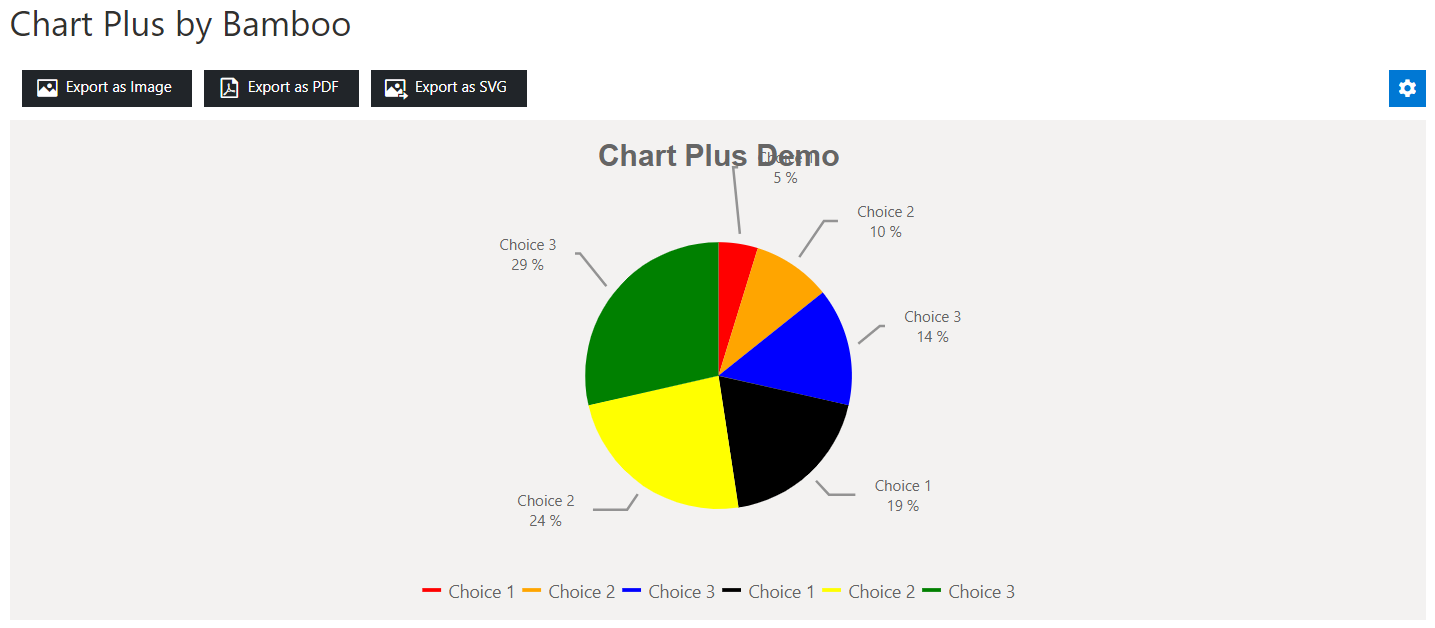
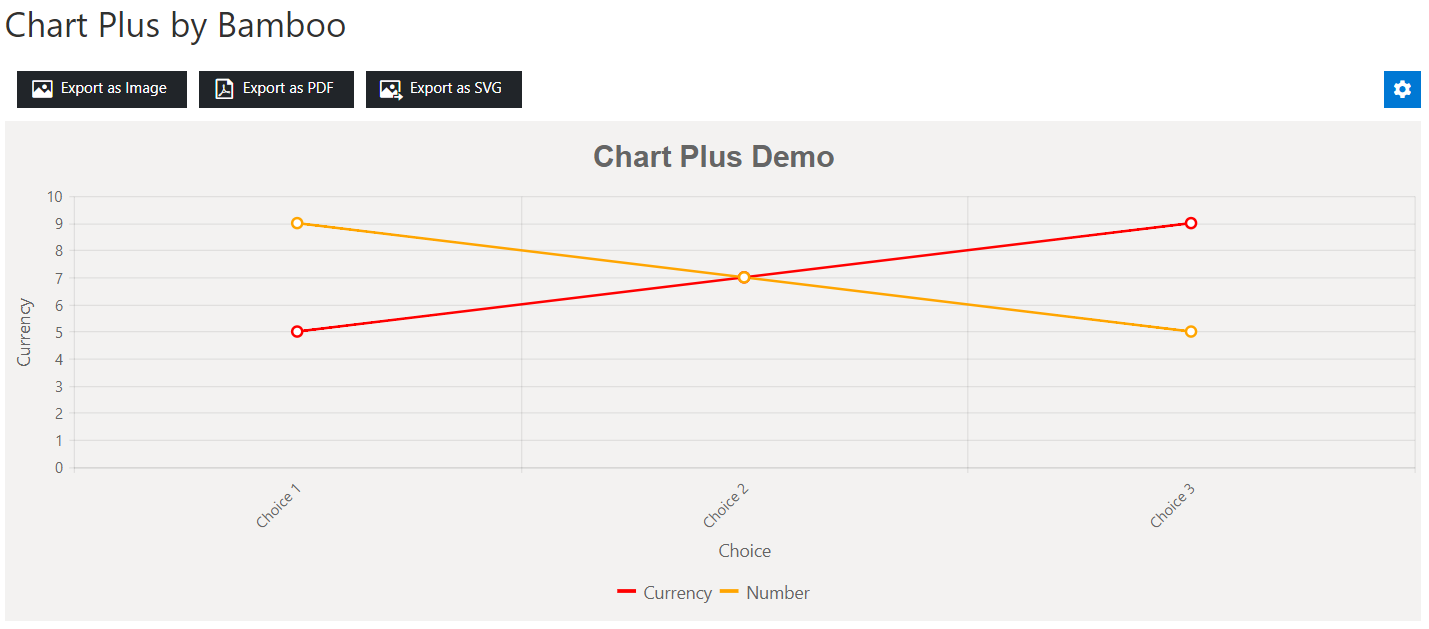
The pictures below will reflect the “Multi-Column” option.
Column:
Bar:
Pie:
Donut:

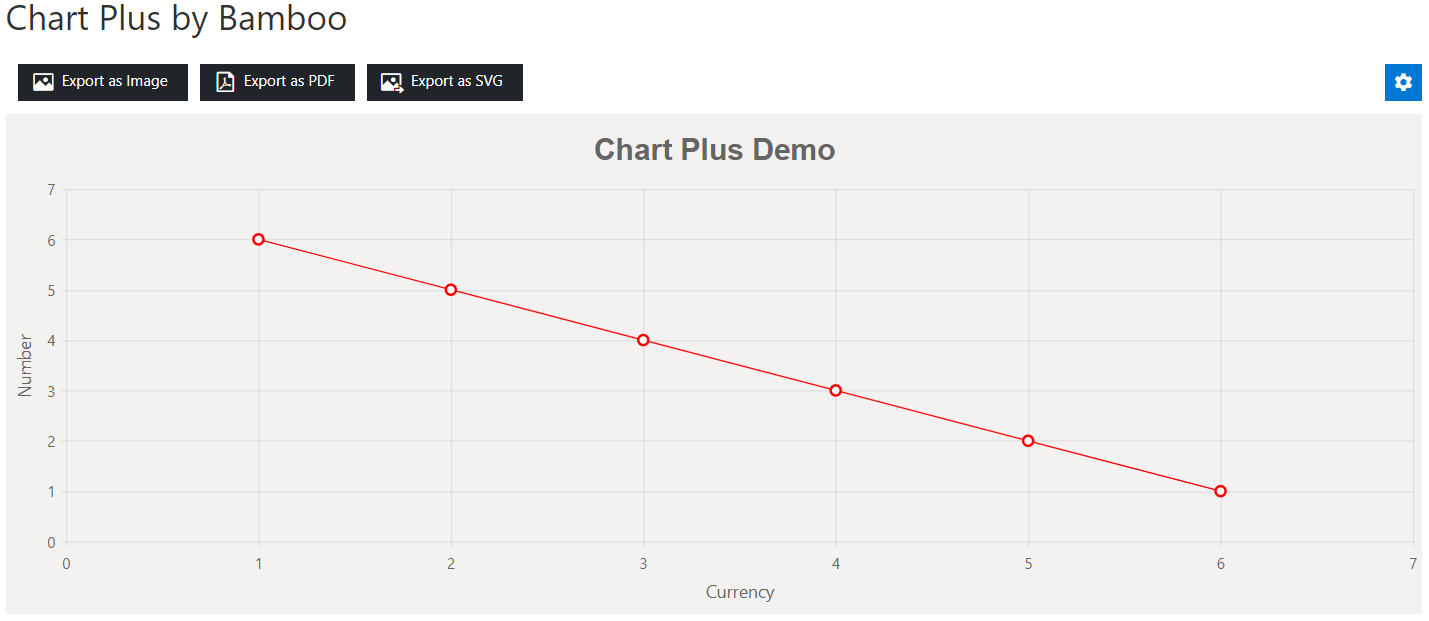
Line:
Area:
Scatter:

Scatter Line:
Bubble:

Chart Plus by Bamboo Solutions offers a wide range of customization options with which to display your list information. This web part does a really good job of covering all the bases. Offering many options you might want to have in order to express your information in an aesthetically pleasing way. The Chart Plus web part also has a very modern and simplistic look. The information does not get lost in the graphic display. Also, if charts are not your forte the Chart Plus web part also has informational tips on certain fields. This further defines the purpose of that feature.
What methods does Chart Plus offer to share the information?
After setting up your chart exactly how you want it, you might be wondering, how do I get this work of art shared with other people exactly? Well, there are multiple ways to share your Chart Plus web part with other people. The first and probably most common way to share your web part would be to send them the link to the page that your Chart Plus web part is on. The user will of course need to have access to the page in order to view the page and the web part that is on it.
